hourlong learnings #5: caffeine dosage, sensitivity, byproducts, and frontier research
In the following post I try to understand what that range does at the receptor and signaling level, how coffee differs from isolated caffeine, what frontier caffeine research shows about the gut–brain axis and neuroprotection, and learn about withdrawal
Caffeine isn’t a direct energy source or a conventional dopamine-releasing stimulant; at ordinary dietary exposure, it’s mainly a competitive antagonist at adenosine receptors, and that action changes presynaptic transmitter release, striatal dopamine signaling, sleep-pressure perception, vascular tone, and immune signaling across different tissues
as usual, a basic thought map is below:
$$ \text{dose and timing} \rightarrow \text{caffeine in blood} \rightarrow \text{adenosine receptors blocked} \rightarrow \text{changes inside cells} \rightarrow \text{felt effects} $$
CYP1A2 metabolism and receptor occupancy sit inside this chain, but the main idea is simpler: the swallowed dose isn’t the same thing as blood exposure, and blood exposure isn’t the same thing as the effect I notice
1. natural and synthetic caffeine are the same molecule
Caffeine is 1,3,7-trimethylxanthine:
$$ \mathrm{C_8H_{10}N_4O_2} \qquad M = 194.19\ \mathrm{g,mol^{-1}} $$
A molecule extracted from coffee and one synthesized industrially have the same covalent structure, mass, and receptor-binding behavior
| Product language | What it usually means | What can change |
|---|---|---|
| natural caffeine | isolated from coffee, tea, guarana, maté, kola, or decaffeination streams | residual plant compounds, purity, dose standardization |
| synthetic caffeine | produced by methylating xanthine precursors or by total chemical synthesis | purity, particle form, formulation |
| caffeine anhydrous | nearly water-free caffeine powder, natural or synthetic | faster and more precise delivery than an unlabeled beverage |
| caffeine citrate | a pharmaceutical formulation containing caffeine and citric acid | dose labeling differs because caffeine citrate isn’t 100% caffeine base by mass |
| coffee, tea, guarana extract | caffeine inside a chemical matrix | polyphenols, melanoidins, theanine, sugars, acids, diterpenes, absorption context |
Stable carbon-isotope ratios can identify whether commercial caffeine came from a plant or an industrial synthesis route. That’s source forensics, not a pharmacological distinction
Carbon-isotope testing asks whether the sample’s $^{13}\mathrm C/^{12}\mathrm C$ ratio is slightly above or below a reference:
$$ \delta^{13}\mathrm C = \left( \frac{R_{\mathrm{sample}}}{R_{\mathrm{standard}}}-1 \right) \times 1000,\text{‰} $$
Here, $R$ is the ratio $^{13}\mathrm C/^{12}\mathrm C$, and the term in parentheses is the sample’s fractional difference from the reference. Plant and petrochemical carbon occupy different $\delta^{13}\mathrm C$ ranges, so this equation can test a sourcing claim; it can’t show a pharmacological difference between two otherwise identical caffeine molecules
Natural production is an isolation process: caffeine already exists in the plant matrix, then solvent, water, adsorption, or supercritical-$\mathrm{CO_2}$ processing separates it according to a partition coefficient:
$$ K_D=\frac{[\mathrm{caffeine}]_{\mathrm{extractant}}}{[\mathrm{caffeine}]_{\mathrm{water}}} $$
The numerator is caffeine captured in the separating phase, while the denominator is caffeine left in water. If $K_D>1$, caffeine prefers the extractant; if $K_D<1$, most remains in water. The equation describes separation, not creation of a new form of caffeine
Synthetic production builds or methylates the xanthine scaffold. One representative final step is N-methylation of theophylline:
$$ \mathrm{C_7H_8N_4O_2} ;+; \mathrm{CH_3{-}} \longrightarrow \mathrm{C_8H_{10}N_4O_2} $$
Theophylline is on the left and caffeine is on the right; adding one methyl group at nitrogen accounts for the difference. In practice, a reagent such as $\mathrm{CH_3I}$ supplies that $\mathrm{CH_3}$ group in the presence of a base. The equation highlights the structural change rather than serving as a manufacturing protocol
Industrial routes can instead use the longer Traube sequence, which builds a substituted uracil from dimethylurea and cyanoacetic-acid chemistry before ring closure and methylation. The route changes sourcing, impurities, cost, and isotope signature, but the purified endpoint is still caffeine
A receptor can’t detect that production history, so if dose and purity are matched, isolated natural and synthetic caffeine should behave the same; when coffee, tea, guarana, or an energy drink feels different, the better explanation is the matrix, dose estimate, or co-ingredients rather than a second kind of caffeine molecule
The molecular mass also makes the 200–400 mg range easier to compare with biochemical studies:
$$ 200\ \mathrm{mg} \times \frac{1\ \mathrm{g}}{1000\ \mathrm{mg}} \times \frac{1\ \mathrm{mol}}{194.19\ \mathrm{g}} = 1.03\ \mathrm{mmol} $$
This converts the swallowed mass into the amount of caffeine molecules. Doubling the mass doubles that amount:
$$ 400\ \mathrm{mg} \times \frac{1\ \mathrm{g}}{1000\ \mathrm{mg}} \times \frac{1\ \mathrm{mol}}{194.19\ \mathrm{g}} = 2.06\ \mathrm{mmol} $$
Those are administered amounts, not plasma concentrations, because distribution volume, absorption time, and clearance sit between oral millimoles and receptor exposure. Caffeine citrate needs one more conversion: its 1:1 caffeine–citric-acid formulation is about 50% caffeine base by mass, so 20 mg caffeine citrate supplies roughly 10 mg caffeine
2. caffeine’s breakdown products are also active
Caffeine is rapidly absorbed, distributes through total body water, crosses the blood–brain barrier, and undergoes little first-pass metabolism. The liver then converts it through CYP1A2:
caffeine
  |
  | CYP1A2 removes one methyl group at different positions
  |
  +--> paraxanthine    ~80–90%   main active metabolite
  +--> theobromine     ~11%      weaker CNS effect
  +--> theophylline    ~4%       active methylxanthine
Paraxanthine, theobromine, and theophylline remain active after the parent caffeine starts falling. The liver then breaks them down for excretion, so exposure doesn’t move directly from “caffeine present” to “nothing present”: several active molecules rise and fall on different curves
CYP1A2 activity varies between people. Smoking speeds caffeine clearance, while estrogen-containing birth control, pregnancy, liver impairment, and drugs that block CYP1A2 can slow it. For a medtech product, one gene result isn’t enough to label someone a “fast metabolizer”; measuring caffeine and paraxanthine over time gives a better answer
The human data below show why the same dose can produce different blood exposure, especially with smoking or estrogen-containing birth control

3. caffeine blocks four adenosine receptors, but two matter most
Adenosine rises around cells during sustained wakefulness, high metabolic demand, low oxygen, injury, and inflammation. Four receptors read that signal, but routine caffeine mainly acts through two of them
| Receptor | What adenosine normally does | Where it matters here | Caffeine relevance |
|---|---|---|---|
| $A_1$ | reduces transmitter release and neuronal firing | broadly distributed across the brain | major target |
| $A_{2A}$ | changes cAMP signaling and restrains the response to dopamine | striatum, blood vessels, and immune cells | major target |
| $A_{2B}$ | responds mainly when extracellular adenosine becomes unusually high | low oxygen, injury, and inflammation | secondary at ordinary exposure |
| $A_3$ | alters immune and injury responses in a cell- and species-dependent way | peripheral tissues and experimental disease models | uncertain for routine human effects |
$A_1$ and $A_3$ generally lower cAMP, while $A_{2A}$ and $A_{2B}$ generally raise it. The exact relay proteins matter when testing a pathway, but this directional split carries most of the explanatory value
At an $A_1$ presynaptic terminal, endogenous adenosine suppresses glutamate, acetylcholine, norepinephrine, dopamine, serotonin, and other transmitters; caffeine removes part of that inhibitory tone, so the downstream result looks like broad transmitter activation even though caffeine didn’t bind those transmitter receptors
At $A_{2A}$ receptors, caffeine blocks a pathway that normally raises cAMP. The result can increase or decrease inflammation because adenosine sometimes acts as an immune brake and sometimes helps sustain an inflammatory response; cell state decides which role dominates. “Caffeine is anti-inflammatory” therefore isn’t a mechanism
4. caffeine changes the response to dopamine; it doesn’t release more
Caffeine affects dopamine indirectly. In the striatum, the same neurons carry adenosine $A_{2A}$ receptors and dopamine $D_2$ receptors, which push a shared internal signal—cAMP—in opposite directions:
$$ \text{adenosine activates }A_{2A} \rightarrow \uparrow\ \text{cAMP} \rightarrow \text{weaker }D_2\text{ response} $$
$$ \text{dopamine activates }D_2 \rightarrow \downarrow\ \text{cAMP} $$
The named machinery behind this opposition is $A_{2A}\rightarrow G_{olf}\rightarrow$ adenylyl cyclase 5 on one side and $D_2\rightarrow G_{i/o}\dashv$ adenylyl cyclase 5 on the other. Those names locate the mechanism, but the concept is that both receptors adjust the same intracellular dial in opposite directions
Adenosine normally activates $A_{2A}$ and restrains the cell’s response to dopamine. Caffeine occupies $A_{2A}$ without activating it, removing part of that restraint:
$$ \text{caffeine blocks }A_{2A} \rightarrow \text{less adenosine restraint} \rightarrow \text{stronger response to dopamine already present} $$
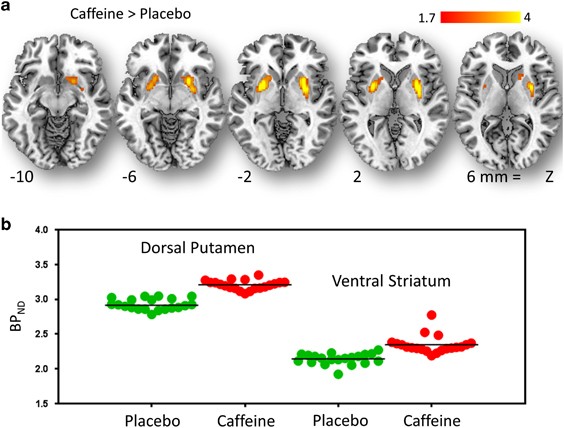
This is different from releasing more dopamine. In a human PET study, 300 mg of caffeine increased measured striatal $D_2/D_3$ receptor availability; if caffeine had caused a large dopamine surge, the released dopamine would’ve competed with the PET tracer and reduced its measured binding. Instead, binding increased, which fits a change in receptor availability or affinity better, although PET can’t fully separate those possibilities
Caffeine and amphetamine can both increase alertness, but they don’t reach that result through the same route: amphetamine raises extracellular dopamine, while caffeine changes how neurons respond to the dopamine already there
The human PET maps show the increase in measured striatal $D_2/D_3$ receptor availability after 300 mg of caffeine
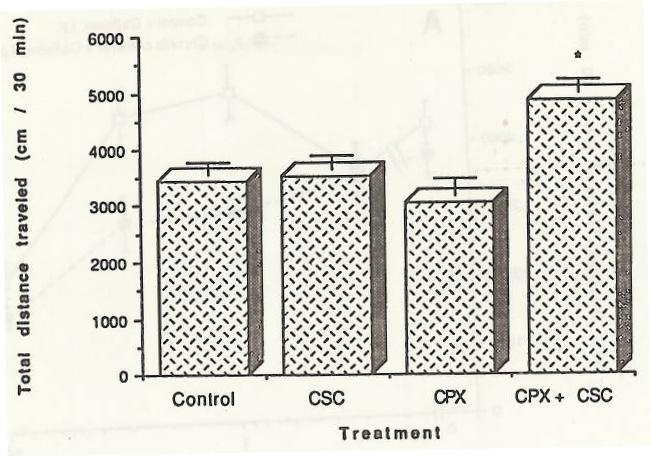
In mice, selectively blocking either $A_1$ or $A_{2A}$ produced little locomotor stimulation, while blocking both produced a larger response. This suggests caffeine’s stimulant effect comes from coordinated changes across the adenosine system rather than one isolated receptor switch
5. the concentration decides which effects are realistic
Many caffeine pathway diagrams mix mechanisms that occur at incompatible concentrations, which makes a concentration check necessary before assigning any pathway to a 200–400 mg dose
In one human PET experiment, 300 mg produced a plasma caffeine concentration of about $5.2\ \mu\text{g/mL}$ at 60 minutes. Converting mass concentration into molecular concentration shows what that means for receptor pharmacology:
$$ 5.2\ \frac{\mu\mathrm g}{\mathrm{mL}} \times \frac{1\ \mathrm g}{10^6\ \mu\mathrm g} \times \frac{1\ \mathrm{mol}}{194.19\ \mathrm g} \times \frac{10^6\ \mu\mathrm{mol}}{1\ \mathrm{mol}} \times \frac{1000\ \mathrm{mL}}{1\ \mathrm L} = 26.8\ \mu\mathrm M $$
the units cancel until only $\mu\mathrm{mol/L}$ remains, letting the measured human exposure be compared directly with concentrations used in receptor and cell experiments
That concentration fits adenosine-receptor antagonism. It’s far below the usual ranges for several alternative mechanisms
| Proposed mechanism | Approximate experimental concentration range | Interpretation at 200–400 mg/day |
|---|---|---|
| $A_1/A_{2A}$ antagonism | low tens of $\mu$M | primary mechanism |
| robust ryanodine-receptor calcium release | about 5–20 mM | laboratory-tool mechanism, not a routine dietary explanation |
| phosphodiesterase inhibition | roughly 0.5–1 mM | unlikely to drive ordinary alertness |
| direct $GABA_A$ benzodiazepine-site interaction | above about 200 $\mu$M | more relevant at high or toxic exposure |
| inflammasome suppression in cultured immune cells | 100–800 $\mu$M | partly above ordinary adult blood exposure, so it doesn’t establish the same effect in daily use |
This concentration audit changes how frontier findings should be read, since a pathway can be real in a dish and still be a poor explanation for a daily coffee habit; it also explains why neonatal caffeine therapy can’t be mapped directly onto adult coffee, because premature infants receive controlled pharmaceutical dosing, clear the drug differently, and are being treated for apnea in a specific inflammatory and respiratory state
6. receptor effects may flatten between 200 and 400 mg
Receptor occupancy is saturating rather than linear:
$$ \text{receptor occupancy} \approx \frac{C}{C+K_i} $$
Here, $C$ is the caffeine concentration near the receptor, and $K_i$ is roughly the concentration associated with half occupancy. The shape matters more than the exact estimate: when $C\ll K_i$, occupancy rises almost proportionally with dose; near $C=K_i$, half the available receptors are occupied; and when $C\gg K_i$, extra caffeine adds progressively less occupancy. Plasma concentration isn’t identical to free concentration at a receptor, and caffeine also competes with changing endogenous adenosine, so this is a conceptual saturation curve rather than a personal calculator
A small human PET study in five people with Parkinson disease measured mean striatal $A_{2A}$ occupancy after coffee. About 129.5 mg caffeine produced 54.2% occupancy; 259 mg produced 65.1%. Doubling the dose added only 10.9 percentage points of measured occupancy
That study is too small and disease-specific to define a universal dose curve. It still exposes an important asymmetry:
higher dose near receptor saturation
→ small additional receptor blockade
→ larger and longer systemic exposure
→ more bedtime residue
→ stronger dependence pressure
For a 200–400 mg/day user, the noticeable benefit can flatten before the sleep cost does. A second 200 mg may block few additional $A_{2A}$ receptors while keeping caffeine active later into the day
Feeling little difference between 200 and 400 mg doesn’t prove the extra 200 mg is inert. It may indicate that the most noticeable receptor effect is already near its plateau
7. caffeine sensitivity has several parts
“Caffeine sensitive” can mean at least five different things
| Type of sensitivity | Main cause | What to measure |
|---|---|---|
| clearance sensitivity | CYP1A2 and interacting exposures | caffeine/paraxanthine concentration over time |
| receptor sensitivity | receptor density, coupling, and ADORA2A-related variation | response at a matched concentration |
| sleep sensitivity | body-clock timing, built-up need for sleep, and sleep structure | time to fall asleep, awakenings, total sleep, and deep sleep |
| autonomic sensitivity | sympathetic and vascular response | blood pressure, tremor, palpitations, anxiety |
| dependence sensitivity | chronic adaptation and schedule regularity | deficit after a missed or delayed dose |
These types can disagree: someone can clear caffeine slowly without feeling wired, clear it quickly but develop anxiety at low concentrations, or feel little boost because tolerance has reduced the noticeable effect while still getting withdrawal after a missed dose. Saying “I can sleep after coffee” is weak evidence because falling asleep doesn’t show whether deep sleep, sleep continuity, or next-day recovery stayed intact
8. gut–brain research is mostly about coffee, not caffeine
Caffeine is absorbed quickly before it reaches most gut microbes. Other coffee compounds reach the colon in larger amounts and give microbes more material to use. This creates a common error: treating a coffee result as a caffeine result
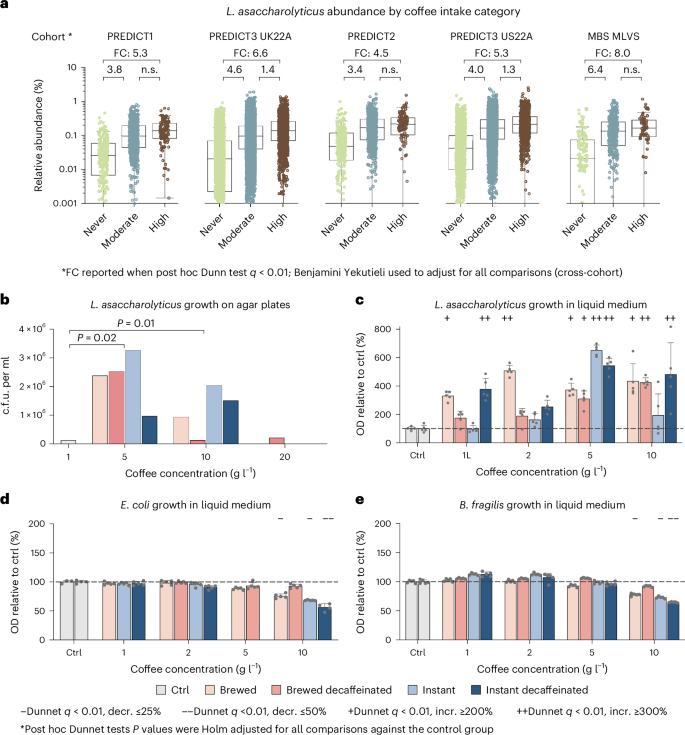
A 2024 analysis integrated detailed dietary data from 22,867 participants with more than 54,000 metagenomes. Coffee intake was strongly associated with Lawsonibacter asaccharolyticus. Its median abundance was 4.5–8 times higher in high coffee drinkers than never drinkers in some cohorts. Coffee also stimulated its growth in vitro
The caffeine-specific interpretation failed an important test. Decaffeinated coffee showed the same leading species association, and both caffeinated and decaffeinated preparations stimulated bacterial growth. The signal belongs to coffee or its non-caffeine chemistry until a specific molecule is isolated
The result is a reproducible dietary microbial fingerprint, but it isn’t evidence that L. asaccharolyticus mediates cognition, reduces neuroinflammation, or explains coffee’s epidemiology
The cohort distributions and culture experiments show both the large species association and direct growth stimulation by caffeinated and decaffeinated coffee
9. what a 2026 human coffee study actually showed
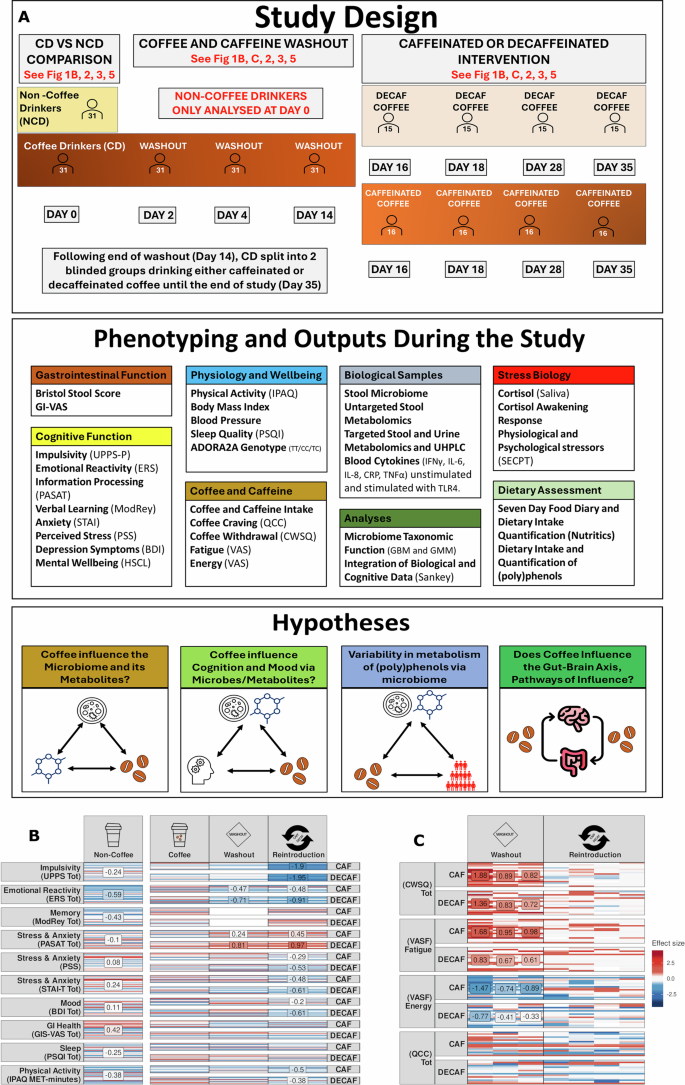
A 2026 study compared 31 non-coffee drinkers with 31 people consuming three to five cups per day. Coffee drinkers then stopped for 14 days and restarted caffeinated or decaffeinated coffee for 21 days. Researchers tracked gut microbes, stool and urine chemicals, cognition, mood, stress, and immune responses
the high-information results were:
coffee drinkers and non-drinkers differed in specific microbial species

abstinence shifted caffeine-, xanthine-, indole-, and phenolic-related metabolites

caffeinated and decaffeinated reintroduction both shifted several microbial species

microbial species, metabolites, and cognitive measures formed statistical networks

withdrawal symptoms were highest early and declined substantially by day 4
the decaf arm is the critical control. It shows that part of the microbiome response is independent of caffeine. Phenolic acids and melanoidins remain plausible drivers
The study design and behavioral heatmaps place the 14-day abstinence period between habitual intake and caffeinated or decaffeinated reintroduction
The network analysis doesn’t prove that a gut change caused a brain change. Gut microbes, chemicals, and test performance could all shift separately because of coffee, sleep, expectations, digestion speed, or repeated testing. To show cause, researchers would need to change one suspected microbe or chemical while holding coffee intake constant, then reproduce the brain or behavior effect
The useful frontier question is narrower than “does coffee affect the gut–brain axis?” It’s:
which compound from coffee
→ is transformed by which organism
→ into which circulating metabolite
→ at what concentration
→ changing which human neural endpoint?
10. caffeine can raise or lower inflammation depending on the cell
The inflammatory pathway studied here works like a two-step safety system: an immune cell first prepares the machinery, then a separate danger signal assembles and activates it
step 1: prepare
bacterial or tissue-danger signal
→ switch on genes for inflammatory machinery

step 2: activate
a second stress signal
→ assemble the inflammasome
→ release IL-1β and IL-18
The complex is called the NLRP3 inflammasome. NF-κB is one switch that prepares it, while caspase-1 is the enzyme that activates its cytokines. Those names locate the steps; the useful model is “prepare, then fire”
In one cultured immune-cell model, fairly high caffeine exposure weakened both steps. In primary human immune cells, another experiment found that caffeine strengthened the same response in one macrophage subtype. The disagreement is the result: caffeine’s direction changed with cell type, dose, stimulus, and measurement time
A retinal-cell experiment found another non-linear response: the low and high tested concentrations reduced one inflammatory signal, while the middle concentration didn’t. More caffeine therefore didn’t produce proportionally more inhibition
the claim that survives is narrow: caffeine can alter inflammatory signaling, but ordinary adult intake hasn’t been shown to switch off systemic inflammation or the NLRP3 pathway in humans
11. caffeine may protect neurons, but human proof is limited
the best-developed neuroprotection case is Parkinson disease
The mechanistic ladder is:
epidemiology
→ higher coffee/caffeine exposure tracks with lower Parkinson risk

animal models
→ caffeine reduces dopaminergic injury in several toxin models

target genetics
→ the protection can disappear when A2A receptors are deleted

human pharmacology
→ caffeine occupies striatal A2A receptors

clinical treatment
→ caffeine trials haven't established disease modification
In an MPTP mouse model, caffeine attenuated striatal dopamine loss in wild-type and heterozygous animals but not in global $A_{2A}$ knockout mice. That’s strong target-dependence in a toxin model. It’s not proof that daily caffeine prevents human Parkinson disease
Human trials haven’t translated that evidence cleanly: a six-week study missed its primary sleepiness endpoint, while a longer Café-PD trial using 200 mg twice daily found no clinically important motor benefit or evidence of disease modification, with tolerance as one plausible contributor
Istradefylline, a selective $A_{2A}$ antagonist used as adjunctive Parkinson therapy, validates $A_{2A}$ as a human drug target. It doesn’t validate caffeine as a precise neuroprotective treatment. Caffeine is short-acting, nonselective, tolerance-producing, sleep-active, and delivered with variable exposure
Timing may explain the gap. Preventing damage during a short animal experiment is different from reversing a human disease that began years before symptoms appeared
12. more caffeine doesn’t clearly mean less cognitive decline
A 2026 longitudinal analysis followed 131,821 participants for up to 43 years and recorded 11,033 dementia cases. Repeated dietary measures were a major strength. Higher caffeine intake was associated with lower dementia risk, with the modeled minimum near 300 mg/day and no clear additional reduction above that range
The measured cognitive difference was small: roughly 0.14 points on the telephone cognitive score between high- and low-intake groups. Dementia records partly relied on reported diagnoses and death records, and other differences between coffee drinkers and non-drinkers could still explain part of the result
the correct interpretation is:
large, long observational data set
+ internally consistent nonlinear association
- small measured cognitive difference
- no randomized assignment
= useful hypothesis, not a daily-dose target
The plateau is still relevant to a 200–400 mg/day user. The observational curve provides no reason to expect 400 mg to be more neuroprotective than 200–300 mg. It may instead increase sleep disruption, which moves cognition in the opposite direction
Neuroprotection should be evaluated as a net pathway balance, not a receptor-only effect:
$$ \text{observed cognitive association} = \text{possible biological benefit} – \text{sleep cost} + \text{other differences between groups} $$
this isn’t a literal equation with commensurate units; it’s a causal accounting model showing why an observational association can’t be assigned to one receptor pathway
13. caffeine withdrawal can last after caffeine leaves the blood
After abrupt cessation, withdrawal usually begins within 12–24 hours, peaks around 20–51 hours, and resolves within 2–9 days. Headache, fatigue, reduced alertness, low mood, irritability, nausea, and impaired concentration are the typical cluster. Regular intake near 100 mg/day can be sufficient
the parent molecule can be mostly cleared while symptoms are still increasing. Withdrawal reflects the removal of chronic receptor antagonism from an adapted signaling system, not caffeine molecules physically leaving the blood
For 200–400 mg/day, a practical interpretation is:
| Time after last dose | Likely interpretation |
|---|---|
| 0–12 h | declining exposure; symptoms may be absent |
| 12–24 h | onset window |
| 24–48 h | common peak window; poor time to judge baseline cognition |
| days 3–4 | many symptoms falling; some people remain impaired |
| days 5–9 | long tail for the minority with persistent symptoms |
| after day 9 | persistent symptoms need another explanation more than a longer “detox” story |
A two-day caffeine break mostly measures withdrawal susceptibility. It doesn’t provide a clean estimate of caffeine-free performance
A taper can reduce peak symptom intensity but blurs the date of the last pharmacologically meaningful exposure. For an experiment, that’s acceptable if the taper is logged and the caffeine-free observation window begins after the final dose
14. what changes between 200 and 400 mg
three separate effects can make 400 mg appear more necessary than it actually is
receptor blocking flattens
The first part of the dose may already capture much of the noticeable $A_{2A}$ effect. Later milligrams extend exposure more than they extend benefit
some of the boost may just reverse withdrawal
Part of the morning effect can be the removal of an overnight abstinence deficit. Performance after caffeine is then compared with a temporarily depressed state, not with a fully adapted caffeine-free baseline
dose timing may matter more than dose size
Alternating between 200 and 400 mg creates dose-linked good and bad days. A 400 mg day can feel unusually effective because it follows a 200 mg day, while the low day can feel weak because it follows a higher recent exposure. The schedule manufactures some of the contrast used to justify the high dose
the testable prediction is that a stable earlier dose near the low end of the range may produce less subjective drama without reducing average function
15. how to find the lowest dose that works
The useful endpoint isn’t abstinence. It’s the smallest and earliest exposure that preserves the valued effect without producing measurable sleep or dependence cost
week 1: current intake
→ log exact product, milligrams, and time
→ record sleep opportunity, alcohol, exercise, illness, and medication changes

week 2: fixed dose and fixed timing
→ remove the 200–400 mg oscillation
→ keep all caffeine before a fixed cutoff

week 3: reduce by 50–100 mg while preserving timing
→ compare vigilance, reaction time, headache, mood, and training output

weeks 4–5: caffeine-free observation
→ taper if needed
→ don't score baseline during the first 72 hours after the final dose
→ preserve at least 7 symptom-light caffeine-free days
Wearable outputs should be treated as repeated proxies. Sleep duration, efficiency, and resting heart rate can identify within-person changes; consumer sleep stages can’t diagnose a molecular mechanism
the most useful low-friction biomarker would be a timed saliva caffeine and paraxanthine measurement, separating “I don’t feel stimulated” from “I cleared the drug”
16. what a caffeine-tracking product should measure
A useful system needs five parts
caffeine intake
Barcode, photograph, product database, serving size, preparation method, and timestamp. Coffee dose uncertainty should be represented as a range rather than false precision
how long caffeine stays in the body
Timed saliva caffeine and paraxanthine, medication and smoking checks, pregnancy status where relevant, and a personal clearance estimate with uncertainty
response at the same blood concentration
Matched-dose changes in vigilance, anxiety, blood pressure, tremor, and sleep. Genetics can be a covariate, not the output
tolerance and withdrawal
Separate acute benefit, overnight withdrawal reversal, and multi-day withdrawal. A model that ignores dependence will overestimate efficacy
what the data can’t prove
Do not infer NLRP3 inhibition, microbiome-mediated cognition, or neuroprotection from a wearable response. Those claims require molecular or longitudinal clinical measurements that the device doesn’t collect
17. the main conclusion
At 200–400 mg/day, caffeine is best understood as a variable-exposure adenosine antagonist, not a fixed stimulant dose
The molecule’s source doesn’t change its receptor pharmacology, although the delivery matrix can change everything around it. $A_1$ and $A_{2A}$ blockade explain ordinary central effects better than PDE inhibition or bulk intracellular calcium release, while $A_{2A}$–$D_2$ receptor interactions explain dopaminergic alertness without requiring a dopamine spike. Gut–brain findings currently implicate coffee chemistry more strongly than caffeine alone, and although the anti-inflammatory and neuroprotective mechanisms are serious research programs, much of the causal evidence still comes from cells, rodents, concentrations above common human exposure, or observational cohorts
For my own 200–400 mg range, the highest-value possibility isn’t that 400 mg is acutely toxic, but that receptor benefit may flatten near 200–300 mg while exposure duration, sleep cost, and dependence continue rising; the personal experiment should test that asymmetry after withdrawal has cleared
TLDR. My personal learning: natural and synthetic caffeine are the same molecule. Coffee and tea can feel different because the dose and other compounds differ. At normal intake, caffeine mainly blocks the adenosine signals that build sleep pressure and limit dopamine signaling. This effect starts flattening as more receptors become blocked, so going from 200 to 400 mg may extend the dose more than it improves the effect. Gut research is stronger for coffee than caffeine because decaf changes gut microbes too. Claims about inflammation and protection from brain disease mostly come from cells, animals, or human correlations, not proof that a daily dose causes those benefits. Withdrawal usually starts within 12–24 hours, peaks at 20–51 hours, and lasts 2–9 days, so a two-day break mainly measures withdrawal. The useful personal test is whether an earlier dose near 200 mg works just as well after withdrawal has passed while causing less sleep disruption and dependence
Comments are closed for this post.