hourlong learnings #2: how a pulse oximeter estimates blood oxygen and why it breaks
A pulse oximeter does not directly count oxygen molecules, measure the partial pressure of oxygen, or sample arterial blood. It sends red and infrared light through tissue, extracts the part of the optical signal that changes with each pulse, and maps that signal through an empirical calibration curve.
A rough model is:
$$ \text{red/IR transmission} \rightarrow \text{PPG signal} \rightarrow \text{AC/DC ratios} \rightarrow \text{ratio of ratios} \rightarrow \text{SpO}_2 $$
As an EMT, SpO₂ is one of the fastest objective measurements I can get. It affects how I interpret respiratory distress, whether an intervention is changing oxygenation, and how quickly a patient appears to be deteriorating. The device still has no direct access to arterial saturation. It is solving an optical inverse problem and displaying the estimate as one clean integer.
1. what the oximeter is actually estimating
The target is arterial hemoglobin oxygen saturation:
$$ S_{\mathrm{a}O_2} = \frac{\text{oxyhemoglobin}} {\text{oxyhemoglobin}+\text{deoxyhemoglobin}} $$
In an arterial blood sample, saturation can be measured using co-oximetry. Pulse oximetry estimates it noninvasively and reports SpO₂.
SaO₂: arterial oxygen saturation measured from blood

SpO₂: peripheral estimate generated by a pulse oximeter

PaO₂: partial pressure of dissolved oxygen in arterial blood
SpO₂ and PaO₂ are related, although they are different variables. SpO₂ is about the fraction of hemoglobin binding sites carrying oxygen. PaO₂ is the dissolved oxygen tension that drives oxygen binding and diffusion.
The amount of oxygen carried in arterial blood can be approximated by:
$$ C_{\mathrm{a}O_2} = 1.34(Hb)(S_{\mathrm{a}O_2}) + 0.003(P_{\mathrm{a}O_2}) $$
$Hb$ is hemoglobin concentration. The first term represents oxygen bound to hemoglobin; the second represents oxygen dissolved in plasma. The first term usually contributes far more. Pulseox estimates one input inside this equation. It does not measure hemoglobin concentration, cardiac output, tissue extraction, or ventilation.
That is why an acceptable SpO₂ does not rule out anemia, low-flow shock, carbon monoxide exposure, or rising PaCO₂.
2. where it fits in a BLS assessment
At the BLS level, I use SpO₂ alongside respiratory rate, work of breathing, breath sounds, mental status, skin signs, pulse quality, blood pressure, and ETCO₂ when available.
The technical value is mostly in serial measurement. A stable 92% and a drop from 99% to 92% are not the same signal. The oxygen device and flow rate also need to travel with the number. A saturation of 96% on room air and 96% after aggressive oxygen support encode different states.
The oximeter also gives a pulse rate and usually some form of pleth waveform or pulse-strength indicator. If the pulse rate on the device does not match the palpated pulse or ECG rate, the saturation estimate deserves less confidence. That check is basically a quick validation that the algo is tracking the patient’s arterial pulsation rather than motion or noise.
3. the optics: red light, IR light, and hemoglobin
Oxyhemoglobin and deoxyhemoglobin have different optical absorption spectra.
Most conventional pulse oximeters use wavelengths near:
red: about 660 nm

infrared: about 940 nm
At the red wavelength, deoxyhemoglobin absorbs more strongly than oxyhemoglobin. At the infrared wavelength, the relationship reverses enough to separate the two species.
The basic optical model resembles Beer-Lambert:
$$ A_{\lambda} = \epsilon_{\lambda}cl $$
At wavelength $\lambda$, absorbance $A_{\lambda}$ depends on the extinction coefficient $\epsilon_{\lambda}$, absorber concentration $c$, and optical path length $l$.
A finger is not a clean cuvette. Light scatters through skin, bone, connective tissue, venous blood, arterial blood, and the nail bed. The path length is not fixed, and the tissue contains absorbers other than hemoglobin. A direct Beer-Lambert solution would require more information than the sensor has.
The device gets around part of that problem by isolating the pulsatile component. The pulse acts like a natural modulation signal: arterial blood volume changes with each cardiac cycle while most other tissue remains approximately constant over that short window.
4. pulling the arterial pulse out of the signal
A transmission pulseox has LEDs on one side of the tissue and a photodiode on the other. The electronics rapidly switch between red illumination, infrared illumination, and often a dark interval used to estimate ambient light.
The detected intensity has two broad components:
DC:
average transmission through tissue, venous blood, nonpulsatile arterial blood,
bone, skin, and the sensor geometry

AC:
the smaller oscillating component associated mainly with pulsatile arterial volume
The photoplethysmographic waveform, or PPG, is this optical signal over time. It is not the same as an arterial pressure waveform. Its shape depends on blood-volume change, vascular tone, sensor position, filtering, and local tissue mechanics.
For each wavelength, the device normalizes the pulsatile amplitude by the baseline:
$$ N_{\lambda} = \frac{AC_{\lambda}}{DC_{\lambda}} $$
This reduces sensitivity to absolute LED intensity, detector gain, tissue thickness, and some probe-placement differences. It does not remove them completely.
The device also has to estimate AC and DC over a time window. A longer averaging window smooths noise but responds more slowly to a real desaturation. A shorter window reacts faster but lets more motion and beat-to-beat variation through. That latency is partly a signal-processing choice, not just physiology.
5. the ratio-of-ratios and calibration curve
The core optical feature is:
$$ R = \frac{AC_{\text{red}}/DC_{\text{red}}} {AC_{\text{IR}}/DC_{\text{IR}}} $$
This is the ratio of ratios. When the normalized red pulsation is large relative to the normalized IR pulsation, the signal is more consistent with deoxygenated hemoglobin. A smaller ratio is generally associated with higher saturation.
The device then maps $R$ to saturation:
$$ \widehat{S_{\mathrm{a}O_2}} = f_{\mathrm{cal}}(R) $$
The calibration function is manufacturer-specific. A simplified version could be represented as:
$$ \widehat{S_{\mathrm{a}O_2}} = \beta_0+\beta_1R+\beta_2R^2 $$
The coefficients come from paired optical measurements and arterial co-oximetry during controlled desaturation testing. So even though the optics are based on hemoglobin absorption, the final percentage is empirical. The mapping inherits the properties of the calibration population, probe, device, reference co-oximeter, and saturation range used during testing.
The FDA’s January 2025 draft guidance proposed updated study and labeling recommendations for medical-purpose pulse oximeters, including more objective measurement of skin pigmentation and broader representation across pigmentation levels. The FDA still lists that document as draft guidance, so it is a proposed framework rather than a finalized replacement for the existing guidance.
6. SpO₂ is not PaO₂
The oxyhemoglobin dissociation curve links oxygen tension to saturation. A common approximation is the Hill equation:
$$ S_{\mathrm{a}O_2} = \frac{P_{\mathrm{a}O_2}^{n}} {P_{50}^{n}+P_{\mathrm{a}O_2}^{n}} $$
$P_{50}$ is the oxygen tension at 50% saturation. The exponent $n$ controls the steepness created by cooperative oxygen binding.
The curve is flat at high PaO₂ and steep at lower PaO₂. On the plateau, a large change in PaO₂ may barely move SpO₂. In the steep region, a smaller drop in PaO₂ can produce a much larger saturation change.
That means a display of 100% does not tell us whether PaO₂ is normal or extremely elevated on supplemental oxygen. It also means the first few percentage points of a downward trend can carry more information than they appear to.
The curve shifts with hemoglobin affinity:
right shift:
higher temperature, higher CO₂, lower pH, increased 2,3-DPG

left shift:
lower temperature, lower CO₂, higher pH, decreased 2,3-DPG,
fetal hemoglobin, and carbon monoxide exposure
Pulseox does not estimate the position of that curve. Two patients can show the same SpO₂ while having different PaO₂ values and different oxygen unloading at the tissue level.
7. one displayed number, several error terms
The screen might show 94%, but the underlying estimate is closer to a distribution:
$$ S_{\text{true}} \sim \mathcal{N} \left( S_{\text{display}}, \sigma_{\text{cal}}^2 + \sigma_{\text{signal}}^2 + \sigma_{\text{patient}}^2 \right) $$
This is only a rough model. The error is not guaranteed to be normally distributed. The terms separate calibration error, current signal error, and patient-specific effects such as pigmentation, perfusion, vascular tone, or unusual hemoglobin species.
The monitor usually hides all three and returns one integer. Some devices expose perfusion index, signal-quality bars, or a pleth waveform, but these are secondary to the saturation display.
The error is also not equally important across the full range. A two-point overestimate around a treatment or escalation threshold can be more consequential than the same error at 99%. Average device accuracy can therefore look acceptable while performance around a decision boundary remains weak.
8. motion, low perfusion, probe geometry, and nail products
A useful signal model is:
$$ y_{\lambda}(t) = s_{\lambda}(t) + m_{\lambda}(t) + v_{\lambda}(t) + a_{\lambda}(t) + \epsilon_{\lambda}(t) $$
$s_{\lambda}(t)$ is the desired arterial PPG. $m_{\lambda}(t)$ is motion. $v_{\lambda}(t)$ is venous pulsation. $a_{\lambda}(t)$ is ambient-light contamination, and $\epsilon_{\lambda}(t)$ is electronic and unmodeled noise.
Motion is hard because it can be rhythmic and much larger than the arterial AC component. Filtering alone cannot always separate the two. Modern devices compare red and IR channels, look at pulse periodicity and waveform shape, and use proprietary motion-rejection algos. Some systems can also use accelerometer data.
Low perfusion creates the opposite problem: the arterial AC signal becomes tiny. This occurs with vasoconstriction, hypothermia, shock, low cardiac output, or excessive probe pressure.
A rough perfusion index is:
$$ PI = \frac{AC_{\text{IR}}}{DC_{\text{IR}}} $$
Manufacturers do not all calculate or display PI identically, but the general idea is pulsatile strength relative to the nonpulsatile optical baseline.
Probe mechanics change the same variables:
too loose:
motion, LED-detector misalignment, ambient light

too tight:
reduced local perfusion and possible venous congestion

nail polish or artificial nail:
changed wavelength transmission

cold extremity:
small arterial AC component

venous pulsation:
nonarterial blood enters the pulsatile term
These are not separate from the algorithm. They directly modify the numerator and denominator used to calculate $R$.
9. why 2 wavelengths fail w/ dyshemoglobins
A standard two-wavelength system is designed mainly around oxyhemoglobin and deoxyhemoglobin. With two optical channels, it cannot independently solve for every additional hemoglobin species.
carbon monoxide
Carboxyhemoglobin can be interpreted by a conventional pulseox as oxyhemoglobin. SpO₂ may therefore look normal or near normal despite impaired oxygen-carrying capacity.
A blood co-oximeter uses more wavelengths to estimate oxyhemoglobin, deoxyhemoglobin, carboxyhemoglobin, and methemoglobin separately.
methemoglobin
Normal hemoglobin iron is mainly ferrous, Fe²⁺. Methemoglobin contains ferric iron, Fe³⁺, which cannot bind oxygen normally.
Methemoglobin absorbs red and infrared light in a pattern that tends to drive the ratio toward a value associated with an SpO₂ near the mid-80s. As methemoglobin rises, the display can converge toward roughly 85% even when the actual arterial oxygen state is higher or lower.
The issue is dimensionality. Two wavelengths can estimate a two-species mixture only under assumptions. Add more unknown absorbers and the inverse problem no longer has a unique solution.
10. skin pigmentation and occult hypoxemia
Melanin changes optical attenuation before light reaches the arterial signal. If that effect is not fully represented in calibration and signal processing, the error can become systematic rather than random.
A 2020 NEJM analysis by Sjoding and colleagues compared pulseox readings with arterial measurements in hospitalized patients. In the studied cohorts, occult hypoxemia—SaO₂ below 88% while SpO₂ read 92–96%—was detected about three times as often in Black patients as in White patients.
Race is a rough proxy for the actual optical variable. A better evaluation measures skin pigmentation directly, records the measurement site, and tests error across continuous pigmentation values.
Technically, the model should be audited for:
mean bias by pigmentation level

variance of error by pigmentation level

frequency of overestimation near clinical thresholds

interaction between pigmentation and low perfusion

interaction between pigmentation, sensor type, and measurement site
The FDA’s 2025 draft guidance moves in this direction by recommending objective pigmentation assessment and broader participant representation in performance studies.
11. a better measurement model
I would separate the problem into two models.
The first model estimates arterial saturation and measurement uncertainty from raw sensor data:
$$ P \left( S_{\mathrm{a}O_2} \mid PPG_{\text{red}}, PPG_{\text{IR}}, PI, M, D \right) $$
$M$ represents motion and signal-quality features. $D$ represents device, probe, and site metadata. The output is a distribution over plausible SaO₂ values, not one integer.
The second model estimates short-term respiratory deterioration from the oxygenation estimate plus other signals:
$$ p_t = P \left( \text{deterioration in }T \mid X_{0:t} \right) $$
The time-series input could include:
SpO₂ estimate and uncertainty
SpO₂ slope
raw or summarized PPG quality
perfusion index
respiratory rate
ETCO₂ value and waveform
oxygen device and flow
heart rate and blood pressure
work of breathing
mental status
A simple logistic model could be:
$$ \operatorname{logit}(p_t) = \beta_0 + \beta_1S_t + \beta_2\Delta S_t + \beta_3RR_t + \beta_4ETCO_{2,t} + \beta_5U_t + \beta_6O_t $$
$S_t$ is current saturation, $\Delta S_t$ is its recent slope, $RR_t$ is respiratory rate, $ETCO_{2,t}$ is end-tidal CO₂, $U_t$ is measurement uncertainty, and $O_t$ encodes oxygen support.
I would start with a transparent model before trying a temporal neural network. The main gain is not necessarily nonlinear complexity. It is using the raw waveform, trend, uncertainty, and oxygen settings instead of treating one SpO₂ value as complete.
12. what the interface should show
The current interface is usually:
SpO₂: 94%
A more useful display could be:
SpO₂ estimate: 94%
estimated range: 91–96%
signal confidence: low
trend: falling
perfusion: weak
pulse agreement: inconsistent
averaging window: 8 seconds
oxygen support: 4 L/min nasal cannula
The range does not need to be presented as a perfect confidence interval. It could be a validated device-specific uncertainty band based on current signal quality and known error patterns.
The interface should also separate “measurement confidence” from “clinical severity.” A clean signal at 84% is high-confidence severe hypoxemia. A noisy signal at 84% is low-confidence but still needs rapid verification. One bar or color should not try to represent both.
13. what data should actually be collected
A useful development dataset needs raw signals, reference measurements, device metadata, and context. Screenshots of the final SpO₂ value are not enough.
optical and device data
raw red and infrared PPG
LED drive and detector gain when available
sampling rate
averaging and filter settings
probe model and site
device hardware/software version
perfusion index
motion and signal-quality flags
reference and physiologic data
arterial co-oximetry SaO₂
PaO₂ and PaCO₂
carboxyhemoglobin and methemoglobin
hemoglobin concentration
heart rate and blood pressure
respiratory rate and ETCO₂
temperature and perfusion state
oxygen device and flow
auditing variables
objectively measured skin pigmentation
age and sex
clinical setting
vasopressor use
movement state
measurement site
time alignment between SpO₂ and arterial sample
outcomes and workflow
time to stable reading
frequency of signal dropout
occult hypoxemia
oxygen or ventilation escalation
need for a second probe site
transport or admission level
Error should be analyzed with bias, precision, root-mean-square error, and Bland-Altman plots. Bias can be written as:
$$ \text{bias} = \frac{1}{N} \sum_{i=1}^{N} \left( SpO_{2,i}-SaO_{2,i} \right) $$
The dataset should be stratified by saturation range, pigmentation, perfusion, motion, probe, device, and site. A single pooled error value can hide the exact subgroups and conditions where overestimation occurs.
14. what I would build based on what I know now
layer 1: raw signal and metadata capture
store red and IR PPG, signal-quality confidence level, perfusion index, probe type, site, device version, filter settings, and averaging window.
layer 2: uncertainty-aware saturation
Estimate a saturation distribution rather than only an integer. The output should widen when the waveform is weak, motion is high, pulse agreement fails, or the input is outside the calibration distribution.
layer 3: context
Combine the saturation estimate with trend, RR, ETCO₂, oxygen support, work of breathing, mental status, HR, and BP. Keep the output narrow: reassessment priority or short-term deterioration risk, not a broad diagnosis.
layer 4: continuous auditing
use with arterial co-oximetry when possible. check for overestimation and dropout across pigmentation, perfusion, movement, device, probe, site, and saturation range.
The product is basically an oximeter that admits when it is uncertain and preserves enough data to prove where the uncertainty may be coming from.
15. graphs and figures
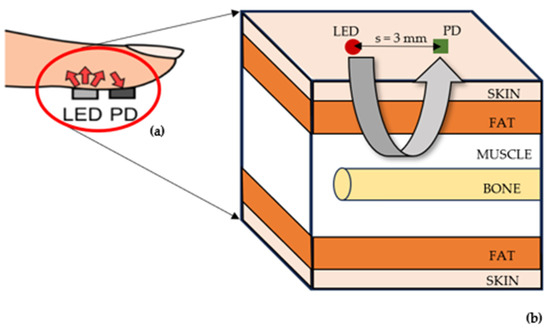
reflectance pulse-ox sensor geometry
how the red and IR LEDs, photodetector, source-detector spacing, and tissue layers are arranged in a reflectance pulseox system.
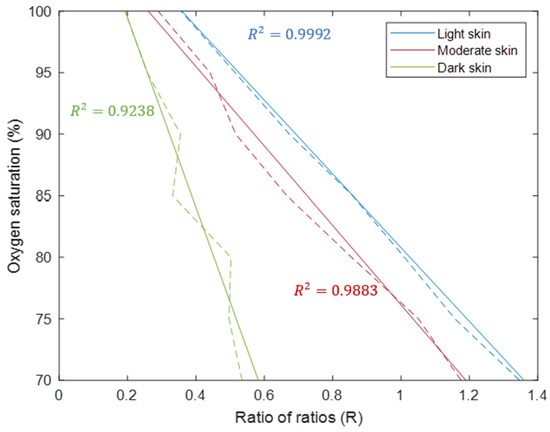
simulated calibration curves across skin pigmentation
simulated calibration curves show how relationship between the ratio of ratios and estimated SpO₂ can shift across skin-pigments
arterial pressure vs. PPG waveform
comparison of arterial blood-pressure waveform w a photoplethysmographic waveform, showing how PPG tracks pulsatile vascular changes without directly measuring it

clinical vs. laboratory PPG signals
simultaneously recorded waveforms show how PPG morphology varies between clinical and laboratory-grade measurement systems

TLDR. My personal learning: pulseox is a 2-wavelength optical estimation system. It isolates pulsatile red and IR absorption, computes a ratio of normalized AC/DC signals, and maps that ratio to SpO₂ using an empirical calibration curve. the main drawbacks are that the estimate breaks when motion, low perfusion, probe geometry, pigmentation, venous pulsation, averaging, or dyshemoglobins change the optical signal in ways the calibration doesn’t account for. A better pulseox would expose the raw signal quality, output uncertainty with the sat level, and store trends
Comments are closed for this post.